

An Overview of Geographic Information System (GIS): What it is And What it Does


Everyone needs the knowledge of the physical environment around them to make decisions that will optimize their lifestyle. A student needs to know the shortest route to school and a business enterprise is interested in the best location to distribute profitable goods. Moreover, other professionals also seek to understand their spatial environment in order to make insightful decisions.
In ancient times, the quest to broaden awareness about the environment (earth) fostered the creation of the science of geography (earth description). Famous explorers such as Marco Polo and Columbus were able to navigate around different parts of the world using a compass, which later led the Europeans into creating colonies in other continents. There is a recurring story of John Snow in 1854, where Snow prevented the spread of cholera disease through knowledge of the source location of the disease. All this understanding and knowledge were possible with the science of Geography. And now, with the advancement of technology and computers, the science of Geographic Information Systems (GIS) emerged to conform with the current demand for location intelligence, thus improving geographical knowledge.
GEOSPATIAL INFORMATION SYSTEM (GIS)
GIS is a powerful tool used to answer specific questions about where a place is located; when it was located; why it is sited at its location; how it is sited relative to other locations, and how beneficial the location is to its environment. A more formal definition of GIS according to Esri, the pioneer and global leader of GIS platform.
“A geographic information system (GIS) is a framework for gathering, managing, and analyzing data. Rooted in the science of geography, GIS integrates many types of data. It analyzes spatial location and organizes layers of information into visualizations using maps and 3D scenes. With this unique capability, GIS reveals deeper insights into data, such as patterns, relationships, and situations—helping users make smarter decisions.“
It is important to note that GIS is not only software and hardware, but a system that comprises computer software, hardware, and a competent human operator. Remember, a computer is useless unless handled by a competent user.
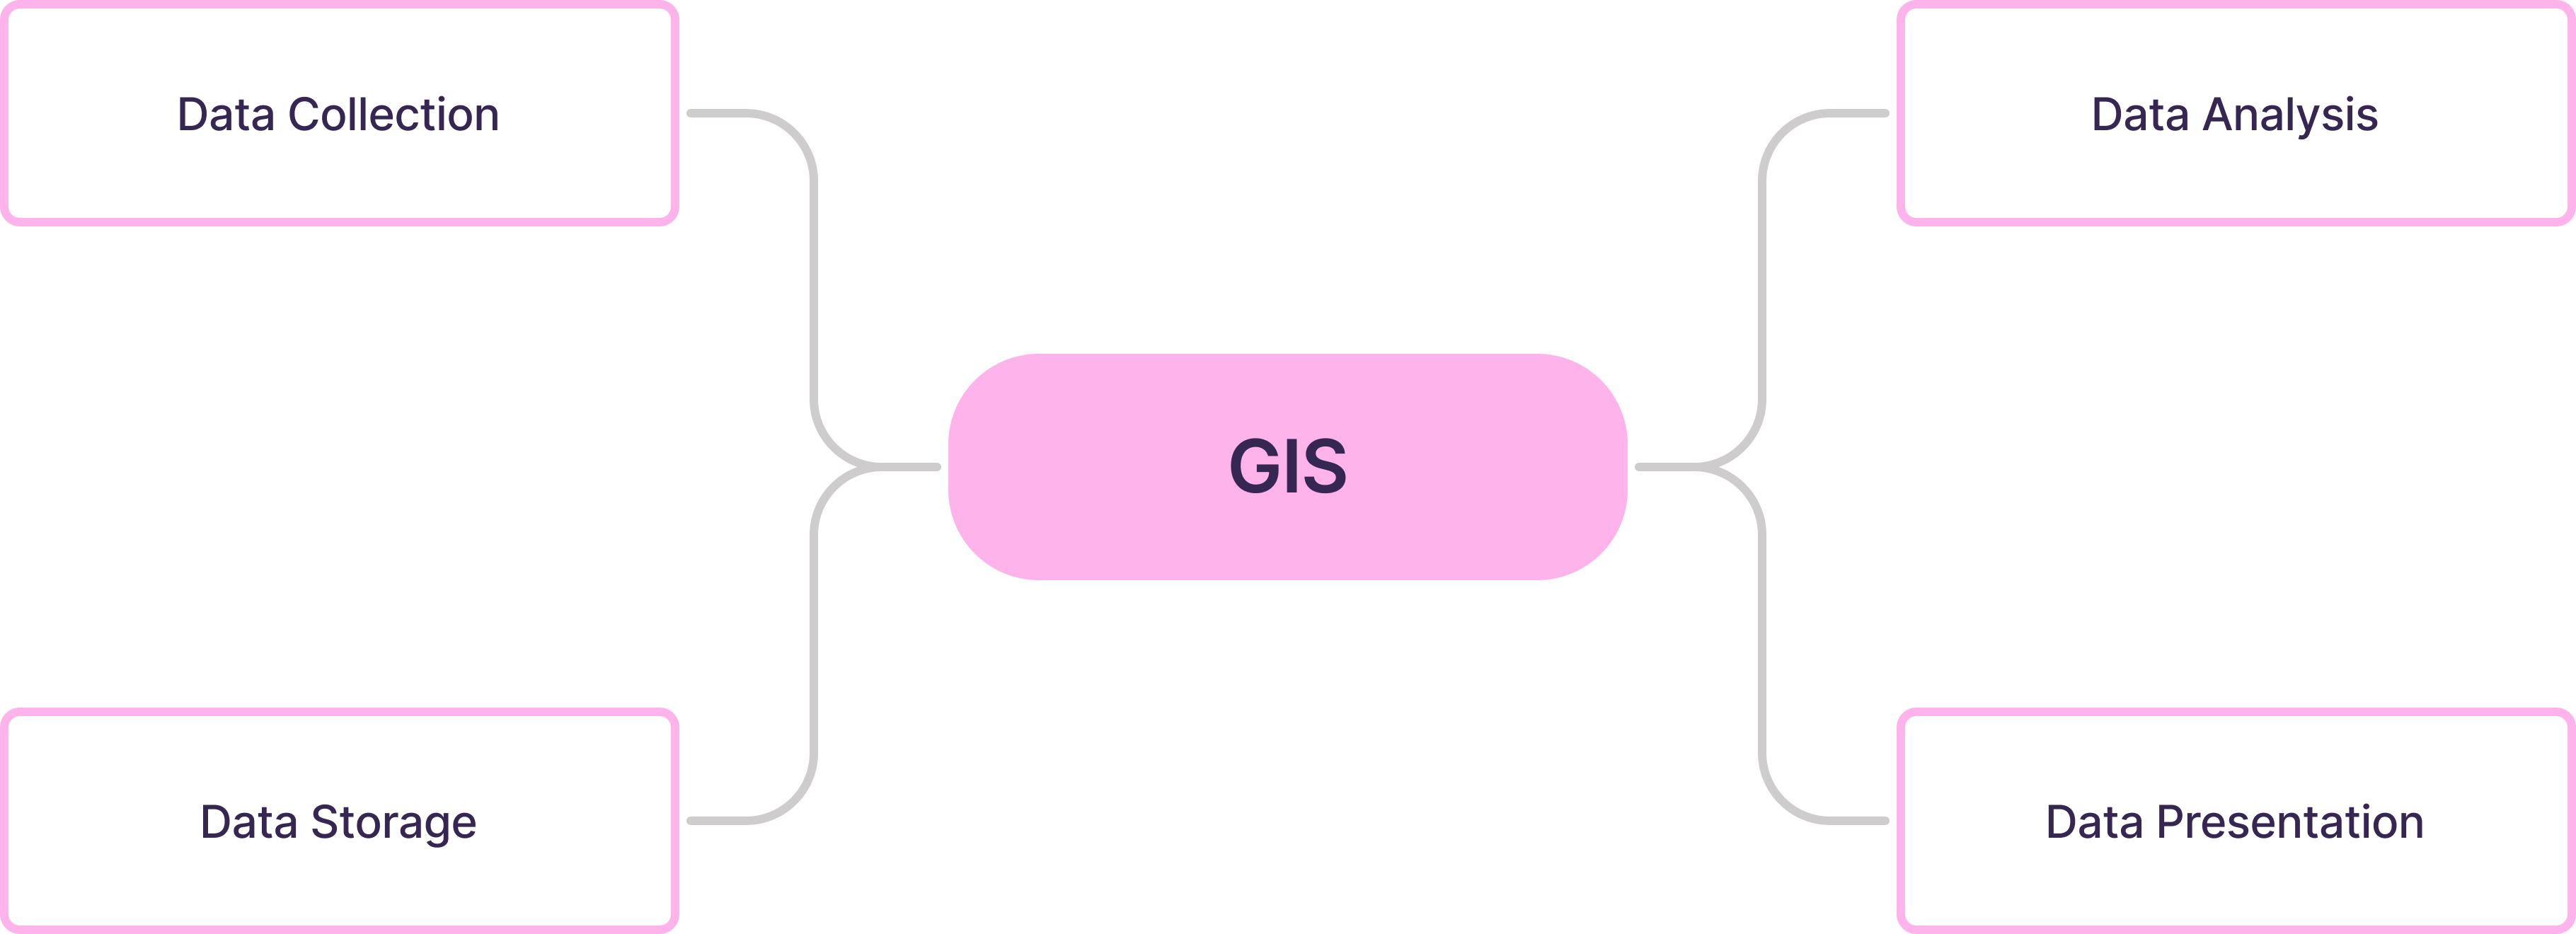
Now, based on the above-stated Esri’s definitions of GIS, we have identified the four basic capabilities and key functions of GIS, which we will go through in the article.
- Data Collection
- Data Storage
- Data Analysis
- Data Presentation/Visualisation
Data Collection
For decision-making to be effective, information has to be formulated and there is no information without data. A GIS tool provides an enabling capability to capture data about the physical environment of the earth. These data generated are commonly tagged as spatial or geospatial data. Although both terms, spatial and geospatial refer to the position of an object in space, the term geospatial is specific because it explicitly refers to space in this context as geo(earth); therefore, making geospatial data a more precise term that describes GIS data, i.e data that can reference any location within the earth’s surface.
With regard to the numerous and different earth’s features, geospatial data are in order to efficiently represent these features in a simplified and digitized format. It is necessary to identify the major categories of geospatial data before diving into the data generation process.
There are 2 categories of geospatial datatype
- Vector data
- Raster data
Vector Data
Vector data abstract features of the earth into a geometric form. It represents each unique feature in a shape-like (points, lines, and polygons) form.
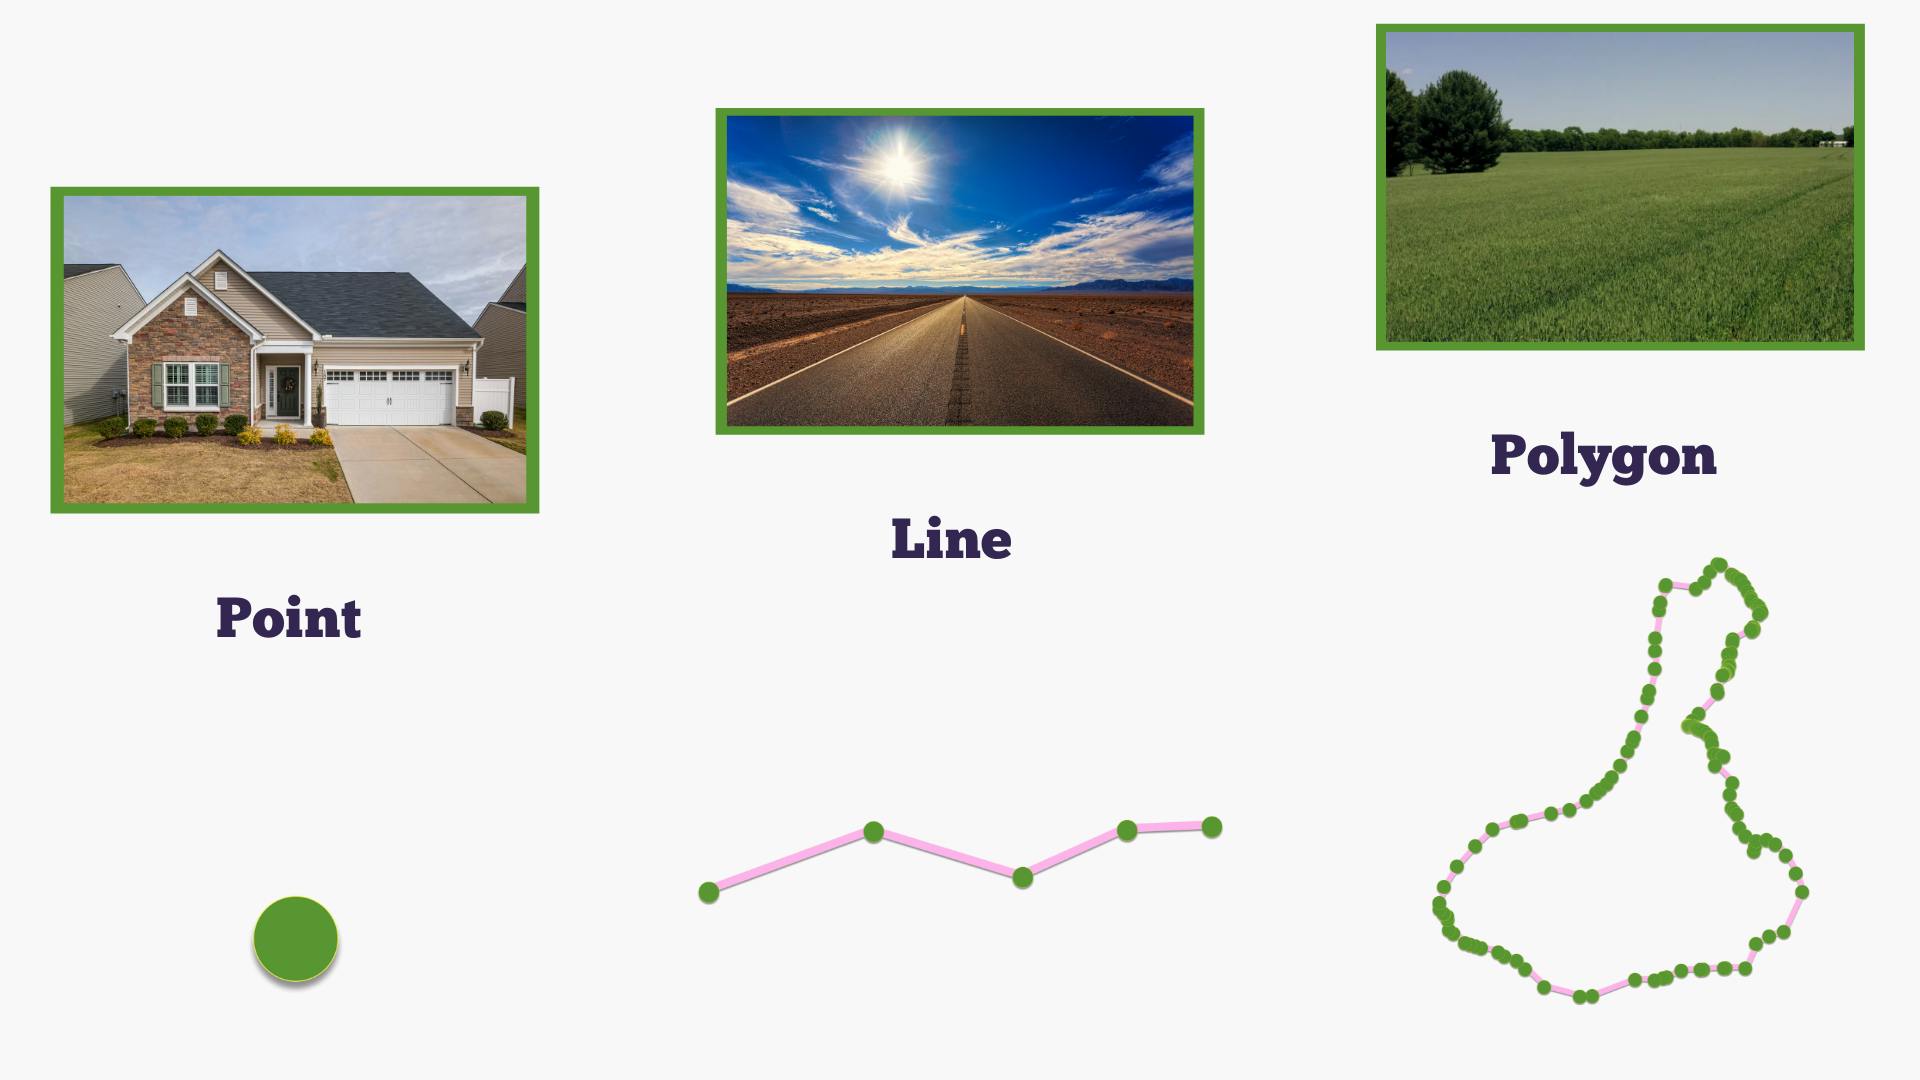
- A point is the fundamental part of vector data. It represents a feature in an (X, Y) geometry, commonly known as lat and long. Features such as houses, schools, trees, infrastructures (poles) can be represented using a point, all these are presented as a single dot signifying the location of the earth with no information about the feature size.
A line consists of 2 or more points, including a dimension to compute for its length. Examples of features that can be represented by lines are roads and rivers.
The last vector data is the polygon, which encompasses more than 2 points having both width and length. Polygon data are used to represent water bodies such as rivers, corn-crop fields, and administrative/country boundaries.
From the various types of vector data, it should be noted that vector data represents discrete features and group them based on their geometric similarity with unique vector datatype.
Raster Data
Raster data are images that describe features of the earth. These images consist of pixels, as you will expect from an image, where each pixel represents a value attributed to the location that the pixel depicts in the real world. Unlike the vector’s point that represents a unique location(co-ordinate), the raster’s pixels is not distinct to a unique location, meaning that it can cover range of locations. Raster data are commonly used to store elevation data - showing the topography of a location, land use cover of places, and weather values.
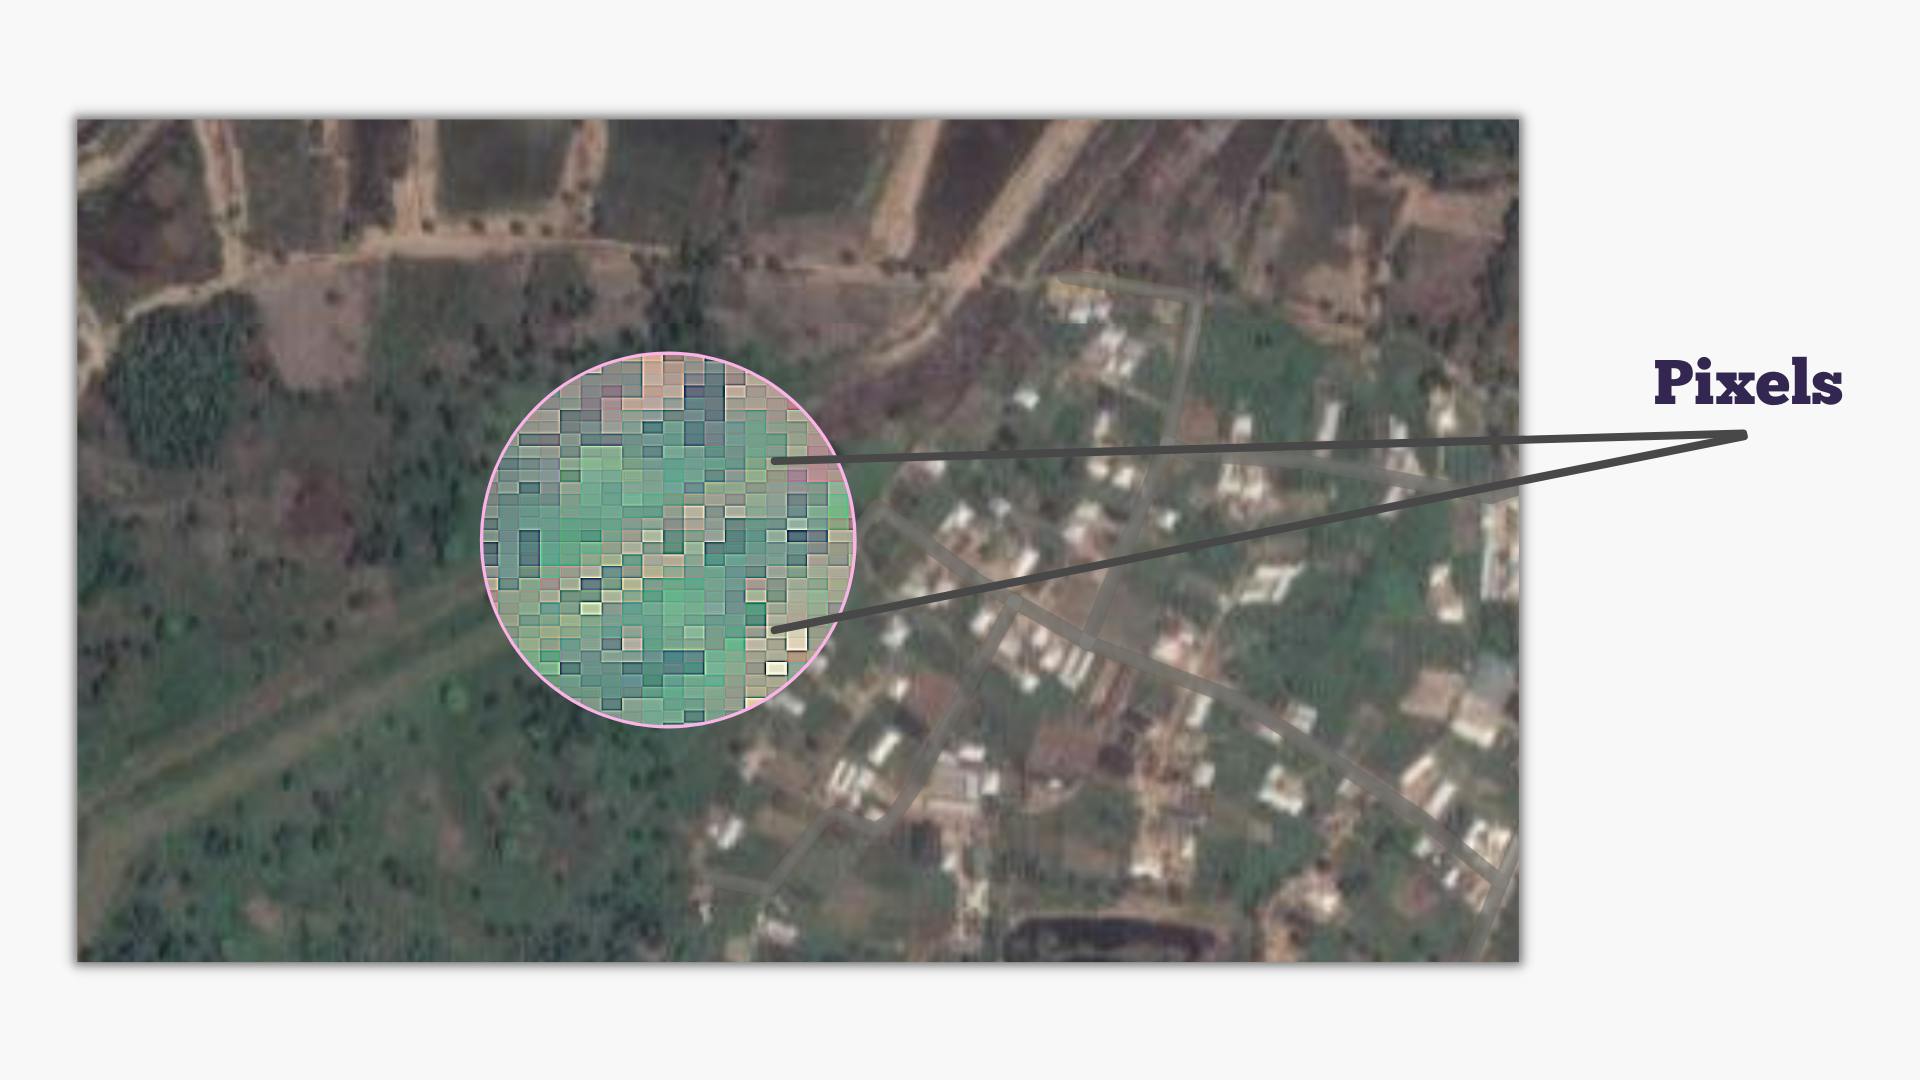 Photo: Satellite image showing an aerial view.
More importantly, when capturing geospatial data, additional information containing attributes of geospatial data are tagged along with this data. For instance, the location of a bread store (geospatial data) can be captured alongside the bread store’s type(loaf or slice), opening time, closing time (non-spatial data) e.t.c. This extra information, termed non-spatial data, is essential for querying, manipulating, and presenting information about a location. A sample of non-geographic data is shown below.
Now that we know the type of data expected geographically, the next question is on how this data can be captured, collected, and gathered. During the early days of GIS, geospatial data could only be primarily captured with highly sophisticated and expensive tools such as GPS devices and Satellite. This changed recently with the invention of technology like the smart mobile phone. Today, it is very easy to capture locational data, such as house location, favorite restaurant location, school location, or any location that has to do with a point(coordinate), using a GPS-enabled smart device with apps like Google Map and Open Data Kit (ODK). In the same light, less expensive drones are available to collect aerial images of a location. Although using affordable devices (Smart Phones and Drones) comes with a trade-off for data accuracy and performance, it does not compromise the fact that they are of great utility.
Another thing to keep in mind during data collection is the availability of secondary data - data that was not primarily captured on-field during a survey or enumeration by an interested user. The data, captured by third-party sources such as international organizations and government agencies, are made publicly available. The data, which include administrative boundaries, population size, satellite images, and more, are usually expensive to collate by a single user; thus, their availability eases cost and aids quick analysis. GRID3 , radiant earth , hum data are just a few examples of organizations that provide secondary data.
Data Storage, Maintenance, and Management
Data must be stored after capture, maintained, and made available when required for analysis or other use. Due to the complex nature of spatial data, data storage must have the capability to efficiently accommodate spatial data features as well as their (non-spatial data ) attributes. Therefore, using traditional and regular data storage systems poses difficulties in appropriately managing the spatial context of GIS data. In response to this challenge, GIS software firms and developers have developed a variety of strategies to store spatial data.
In its simplest form, geospatial data can be stored in a flat-file format like comma-separated value (CSV), excel spreadsheet, and text file. This format is efficient to store vector point data as it stores spatial features in only two columns (latitude and longitude). Inclusive of point vector data, complex vector data like polygons and lines are appropriately stored in other file formats such as Shapefile and Geojson, depending on the GIS software/technology in question. On the contrary, raster data are images and are saved in an image format such as GeoTIFF, tiff, and so on. In a nutshell, data file formats are commonly utilized when working with simple data for exchange, one-off analysis, and processes that require no relationship with another data detail. These mentioned file formats are not exhaustive, more examples of GIS file formats can be found in Gislounge.
From the above point, vector and raster data are stored in separate file formats due to the difference in their data structure; however, a database or geodatabase is an exception to this case as both raster and vector data can be saved in a common file model.
 Photo: An elevation raster data saved in .tif file format for analysis
Real-time and multi-user applications, notably in the case of a web application, require the capability of relational database storage. A relational database system in GIS has the functionality of a regular RDBMS plus the ability to efficiently handle geospatial data. The most common is PostgreSQL (with post-GIS add-ons to handle geospatial data). With the advent of big data, data cloud warehouse tools like google BigQuery now provide spatial data management support.
As in other technology fields, data management in GIS is very critical and must be handled with care to avoid loss of data and decay. Wrong data will result in erroneous inference and insight from the analysis.
Data Analysis and Manipulation
Following a canonical order of operation, after data about the environment has been secured and safely stored in storage. The next point of action is to make this data useful by manipulating and transforming them into insightful information. This can be accomplished through the use of GIS’s analytical capability.
GIS analysis, also known as spatial analysis, is the fundamental and core capability of GIS. It answers the questions of where, when, why, and how of a location using analytical and statistical methods to derive new data. Patterns originating from locational data at this level are identified, explained, and optimized. Like every other analysis, before analysis is carried out, it is critical to define the question to be answered or the hypothesis to be proven. The objective will determine the analytical method to be utilized for a better solution.
GIS analytical method is a factor in the problem to be solved. Some methods are basic and describe features in a straightforward way, such as summary statistics (mean, max, min, area, length), while others are more complex like an interpolation in raster, which is used to estimate the content of a missing value in a location using the value of its closest location.
Both data-type and data-category influence an analytical method set out for use, as techniques for vector data differ from those for raster images. For example, you may discover the number of beer parlours within 50 km radius of a school(vector point) by first creating a 50 km radius area around the school (point). This area can be created using a method called buffering, however, it cannot be applied to raster data. In another way, slope computation, a neighbourhood mathematical technique for determining the susceptibility of an area to flood can only be computed on a raster image(elevation data). Notwithstanding, there are some statistical approaches that are applicable to both vector and raster data.
 Image: (1) Spatial analytical/processing/statistical functions in QGIS (2) Result of a buffer function on a point data in QGIS.
Spatial analysis can also be categorised by purpose. While certain analytical methods can be generalized or applied across a variety of GIS applications, several analytical methods are exclusive to a particular profession and application. For instance, network analysis, least-cost path, and shortest path function that deals with optimal route planning and service allocation are more general. These functions are often seen in google’s map shortest route navigation. Whereas method like viewshed analytic is specifically found to be applied by telecommunications engineers in selecting a location with a clear line of sight to build a base station.
Finally, about analysis, the majority of these techniques are found in the toolbar of GIS software, which provides an easy-to-click interface without having to worry about calculating the algorithm. GIS software packages combine different methods to analyze and answer spatial questions and generate insight towards the objective to be solved.
Data Presentation/Visualisation
 Photo by
 Only when a message can be transmitted can data be converted into valuable information. The most appealing means to convey messages from spatial data is by using a map. A map is a visual representation and description of the world, its reveals pattern in a spatial data in form of spatial distribution and shows relationship and trends in spatial data.
The capacity to visualize data in GIS cross-cuts other spatial capabilities. A map acts as a visual during data collection to validate the authenticity of data acquired before being accepted for storage. In the same light, it serves as a visible interface to display content in the database. On top of that, its use during data manipulation is particularly significant since it displays results of analysis while simultaneously functioning as visual assistance to think and interact with the data during this process; for example, while using buffering- analytical function- it is essential to view the extent of the buffer created for easy feedback and iteration. And finally, and perhaps more crucial, is the use of a map to effectively present information and reveal spatial patterns to a target audience in an effective and compelling way that prompts thinking and decision-making.
Before data can be communicated on a map, it is important to take note of the following points and answer certain questions with respect to the information to be projected.
- What is the specific purpose of the map?
- What is the type of data to be communicated?
- Who is your audience?
- Medium of Communication?
Structuring your questions in the above form will help to clearly map out plans on what needs to be done. In view of answering this question, let’s work through the structural explanation of these questions.
Purpose
Maps for visualization can be for general purposes or specific understanding of a topic. Based on this, maps can be categorized into two groups. Topographic (General reference Map) and Thematic Map.
General reference Map (Topographic): As the name implies, general; this visual is used by regular users and for general purposes. This is an easy-to-understand map that displays both the physical and artificial features of the earth, in its exact/raw form without any preprocessing. General reference maps are majorly used for navigation and also as an interface for a quick view of the data while validating, during the data acquisition process. Examples of general reference maps are google navigation maps, satellite images.
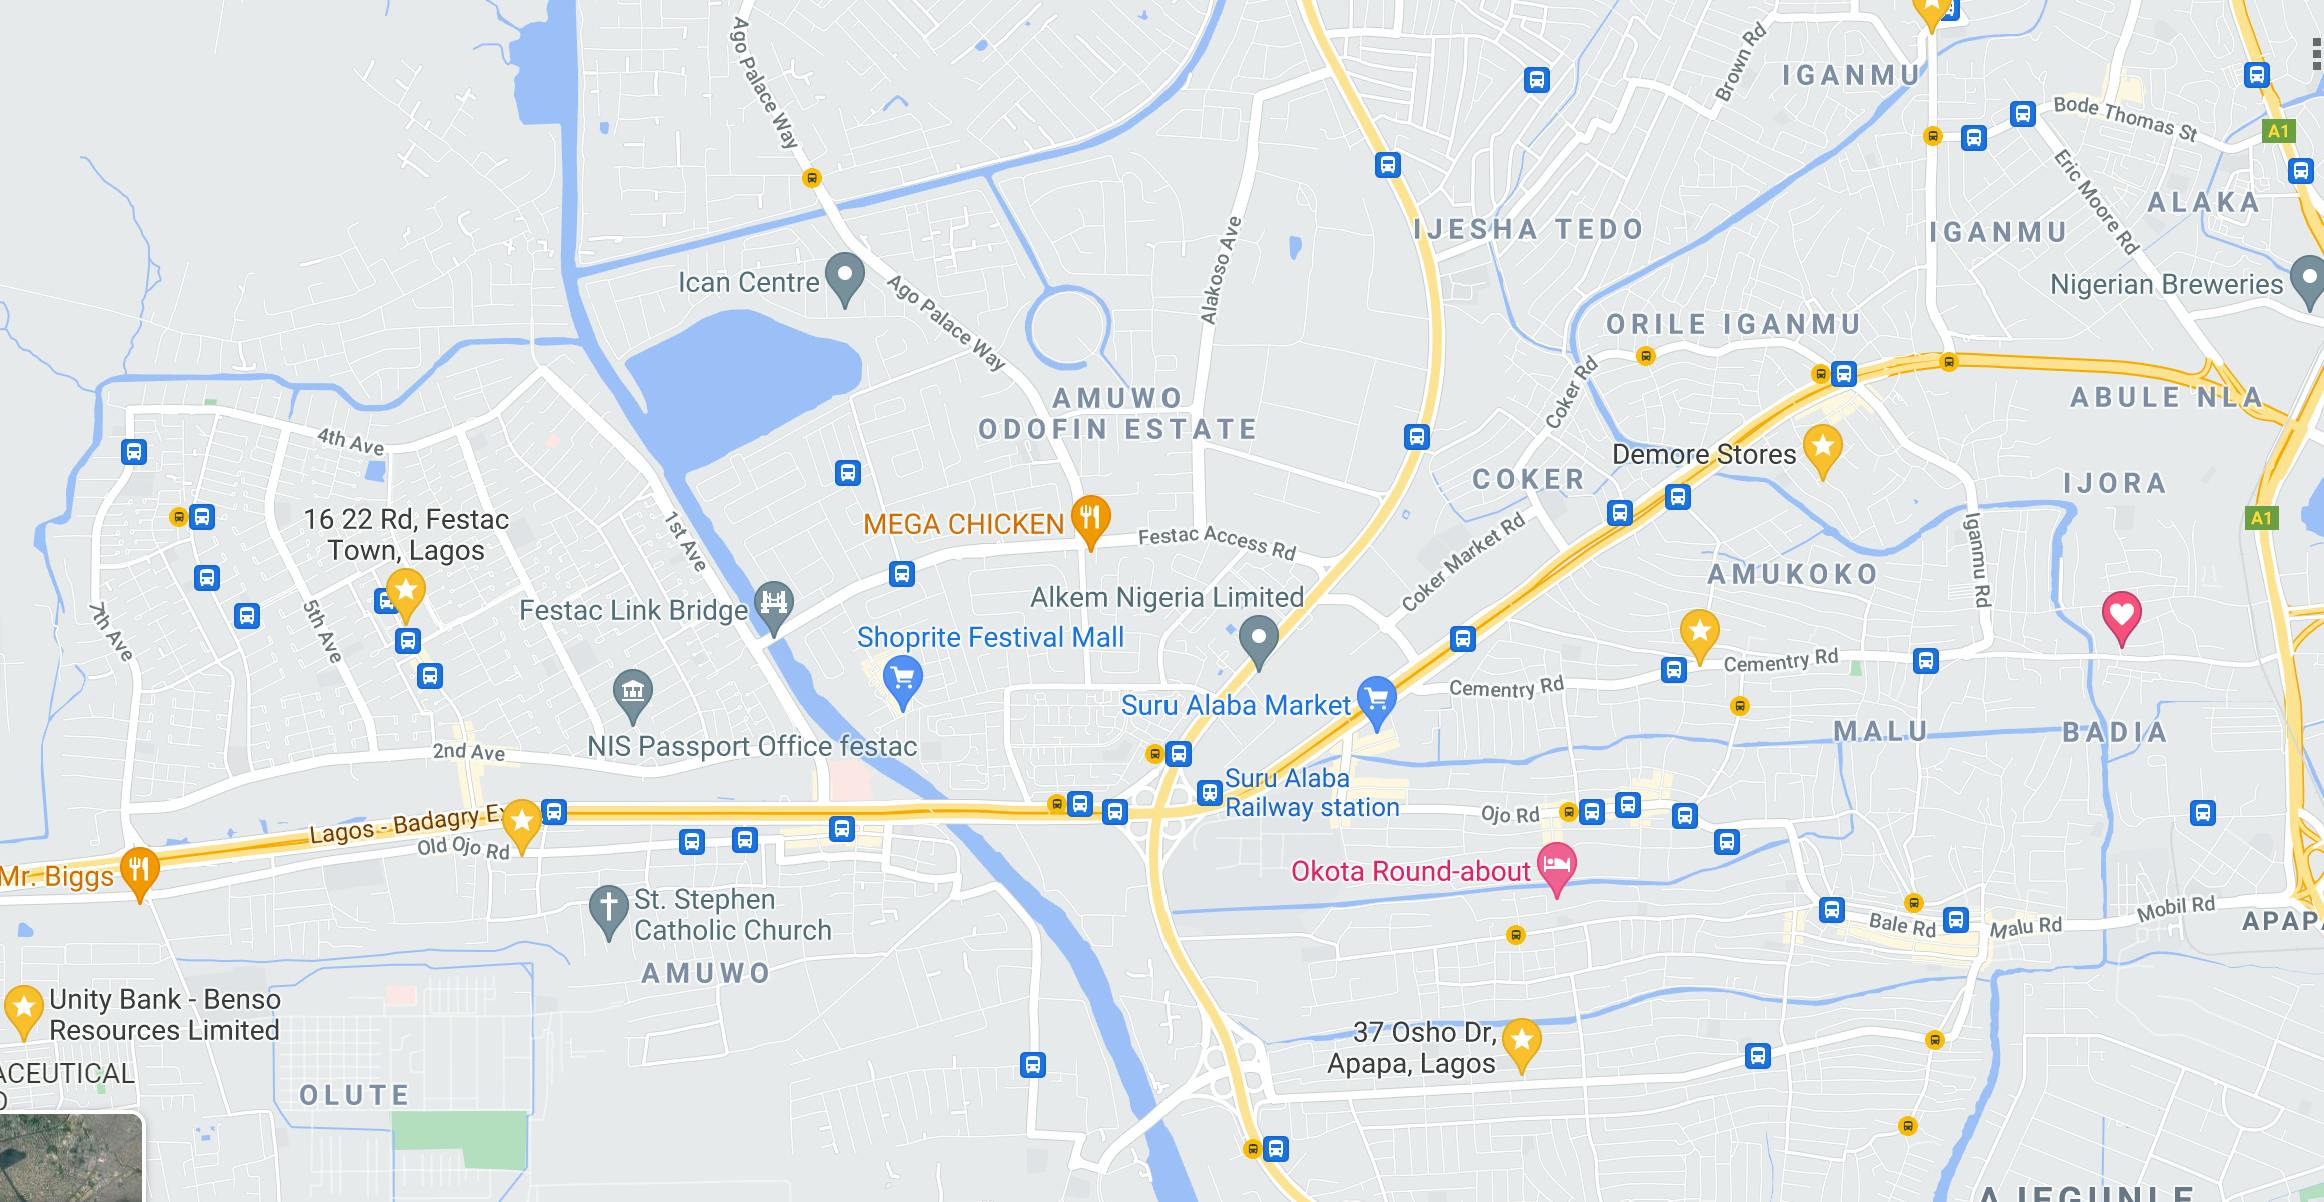 Photo: Google map displaying general reference map
Thematic Map: This map displays the characteristics or attributes of a feature pertaining to a particular topic. It is the most effective way to display and reveal patterns and relationships in spatial data. Thematic maps are used to show the result of spatial analysis to aid statistical thinking and majorly used to communicate the result of spatial analysis to decision-makers. Note that some visual purposes might need the encompassing of both thematic and topographic maps. Hence, it is not odd to see the intertwining of both in some created maps.
Communicated Data
Topographic maps display data in their natural format. It basically consists of raster satellite imagery and vector data (point, line, and polygon), all in their pure form. All these data are displayed in their spatial location without taking details of specific topics pertaining to a region. It requires no special styling or formatting to highlight specific information.
Thematic maps, on the other hand, highlight the attributes of features pertaining to a particular topic. Data in these attributes are available in the form of text or numbers; majorly numbers, especially as a result of statistical analysis. Temperature, density, and income of a location are examples of data that can be visualized using a thematic map and are mostly visualized using color to portray the degree of intensity of its value.
Audience
The reader of the map's knowledge initiates the standard and manner of presenting the information. Most generic map users will have no need to use a thematic map, but it is very common for a user to utilize a map for navigation and location search that will guide their spatial decision. Whereas, few map users might require a top-level insight of a topic in a geographical region, which is commonly utilized by government, organization, and C-level officers. Therefore, communicating analytical results, patterns, and findings using a thematic map; presented as simple and possible, will help understanding that will trigger actionable decision-making.
Medium of Communication
After gaining knowledge of your audience, it is left to you to define the aesthetics, looks, and interactivity that is more suitable. A thematic map is majorly portrayed in an ariel polygon, with each polygon displayed in a color that depicts the values ascribed to the location with the polygon unit. A Choropleth Map is habitually put to use as a thematic map, though there are other thematic map examples like Heatmap, Dot-density map, Graduated Map e.t.c and can be displaced as a Choropleth Map, being the most common type of visuals.
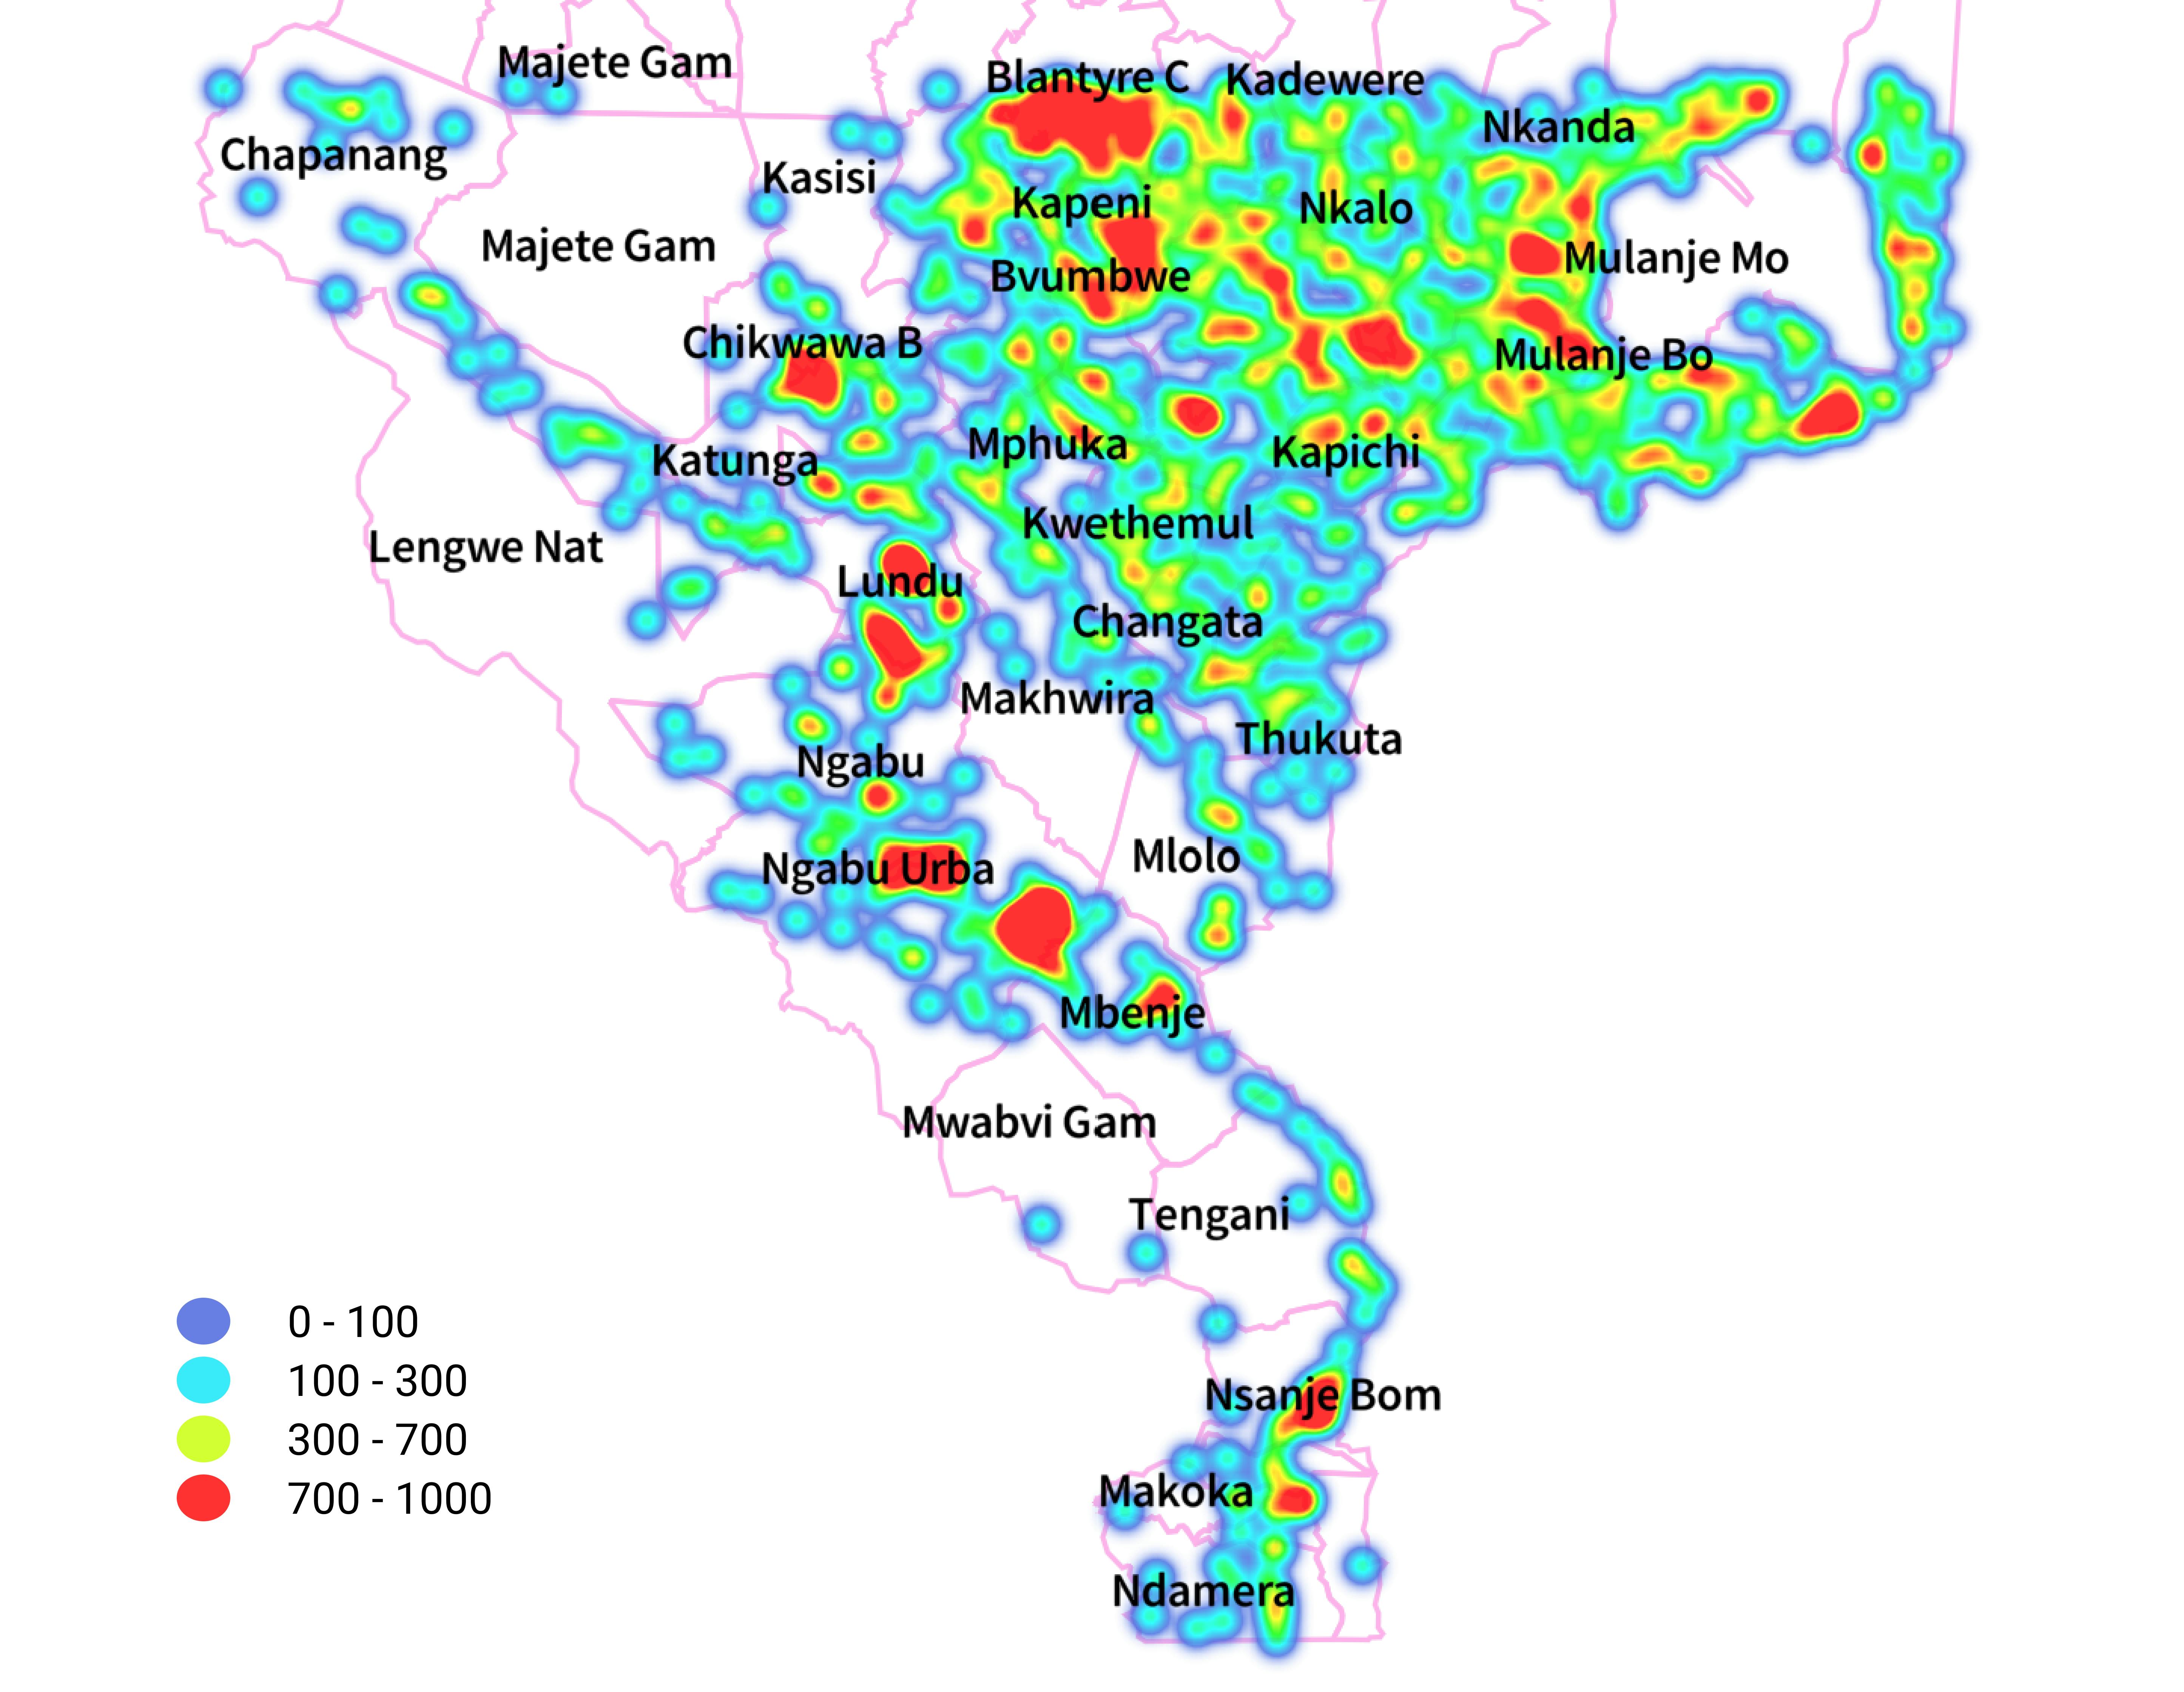 Photo: Thematic heat map, made with Mapbox, showing the population density in Southern Malawi
In addition, the interactivity of your map, whether static or dynamic, is important.
With new emerging technology, more maps are now interactive. When presenting maps to aid navigation, it is highly significant to make your map dynamic. However, static maps are still essential if you wish to include a map in a presentation document.
Apparently, GIS software packages have the capability to create maps; even so, there are some software built specifically to efficiently handle visualisation, these applications include the likes of Mapbox, Carto, Tableau, SmartDraw, etc.
CONCLUSION
Now, more than ever, GIS is cutting edge across other disciplines; gone are the days of GIS being attributed to specific discipline and activity, as can be seen in its application by professionals in their day-to-day activities, whether in retail, transportation, environmental, telecommunications and so on. Thus, as we move in the light of emerging technologies, it is of great essence to recognize that locational-based information that drives impact is embedded in nearly everything, as a result, understanding how to harness its potential can greatly help decision-makers in a positive manner.